
Install the app
How to install the app on iOS
Follow along with the video below to see how to install our site as a web app on your home screen.
Note: This feature may not be available in some browsers.
You are using an out of date browser. It may not display this or other websites correctly.
You should upgrade or use an alternative browser.
You should upgrade or use an alternative browser.
VM keeps running
- Thread starter MikeE
- Start date
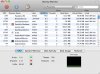
My vm app is called prl_vm_app instead of Parallels VM in the process list. Using Inspect in Activity Monitor and clicking Open Files and Ports, I get this:
/Library/Parallels/Parallels Service.app/Contents/PlugIns/Parallels VM.app/Contents/MacOS/prl_vm_app
It has a very small list of other open files related to the virtual machine and it's virtual hard disks.
When I Suspend the virtual machine, the prl_vm_app quits after 60 seconds.
When I shutdown Windows, the prl_vm_app quits when the virtual machine stops running. I don't use the Parallels Shutdown option.
prl_vm_app only uses about 2% while suspended for that one minute.
Does turning off "Use animations" in the Parallels Desktop preferences change anything?
What about "Automatically compress virtual disks" in the virtual machine Optimization settings?
/Library/Parallels/Parallels Service.app/Contents/PlugIns/Parallels VM.app/Contents/MacOS/prl_vm_app
It has a very small list of other open files related to the virtual machine and it's virtual hard disks.
When I Suspend the virtual machine, the prl_vm_app quits after 60 seconds.
When I shutdown Windows, the prl_vm_app quits when the virtual machine stops running. I don't use the Parallels Shutdown option.
prl_vm_app only uses about 2% while suspended for that one minute.
Does turning off "Use animations" in the Parallels Desktop preferences change anything?
What about "Automatically compress virtual disks" in the virtual machine Optimization settings?
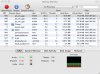
I am now seeing the same as you described - pri_vm_app. I started and suspended 3 times. The last time i turned off "use animations". Compress VM was already off. As seen in the attached I now have 3 pri_vm_app running at about 81%. I am using an iMac 27" with osX 10.6.4. I am also running Parallels on my MacBook pro and I have never seen this problem. Strange....
Attachments
What do you mean by "started and suspended 3 times"? Did you shut down the virtual machine at all? Does startup mean Resume (after Suspend) or Start (after Shut Down)?
In Activity Monitor, select each prl_vm_app and click Inspect, then click "Open Files and Ports". Do they all use the same .pvm files?
In Activity Monitor, select each prl_vm_app and click Sample. Does the output give a clue what it's spending 80% of your CPU on while it is suspended?
For example, my prl_vm_app uses the following virtual machine related files:
In Activity Monitor, select each prl_vm_app and click Inspect, then click "Open Files and Ports". Do they all use the same .pvm files?
In Activity Monitor, select each prl_vm_app and click Sample. Does the output give a clue what it's spending 80% of your CPU on while it is suspended?
For example, my prl_vm_app uses the following virtual machine related files:
Code:
/dev/disk4s2
/dev/rdisk4s2
/Users/joevt/Documents/Parallels/BootCamp2.pvm/{1fe9fd38-3b66-4563-9590-d463cf93aa42}.mem
/Users/joevt/Documents/Parallels/BootCamp2.pvm/{1fe9fd38-3b66-4563-9590-d463cf93aa42}.mem.sh
/Users/joevt/Documents/Parallels/BootCamp2.pvm/{1fe9fd38-3b66-4563-9590-d463cf93aa42}.mem.sh
/Users/joevt/Documents/Parallels/BootCamp2.pvm/ST31000528AS (disk4).hdd/PhysicalGpt.hds
/Users/joevt/Documents/Parallels/BootCamp2.pvm/ST31000528AS (disk4).hdd/PhysicalGptCopy.hds
/Users/joevt/Documents/Parallels/BootCamp2.pvm/ST31000528AS (disk4).hdd/PhysicalMbr.hds
/Users/joevt/Documents/Parallels/BootCamp2.pvm/ST31000528AS (disk4).hdd/ST31000528AS (disk4).hddHere is a screen shot of the current running Parallels VM and the SampleL
Sampling process 1448 for 3 seconds with 1 millisecond of run time between samples
Sampling completed, processing symbols...
Analysis of sampling prl_vm_app (pid 1448) every 1 millisecond
Call graph:
2547 Thread_82297 DispatchQueue_1: com.apple.main-thread (serial)
2547 start
2547 start
2547 start
2547 CFRunLoopRun
2547 CFRunLoopRunSpecific
2547 0x103c020cd
2547 0x103c02183
2547 __apeapp
2547 __apeapp
2547 APEBundleMainEarlyLoad
2547 WSXCommon_Initialize
2547 WSX_SP_Initialize
2547 AudioServicesCreateSystemSoundID
2547 InitializeSystemSoundPorts(bool)
2547 CFRunLoopAddSource
2547 CFSetApplyFunction
2547 CFBasicHashApply
2547 __CFSetApplyFunction_block_invoke_1
2547 CFRunLoopAddSource
2547 __spin_lock
2547 Thread_82300 DispatchQueue_2: com.apple.libdispatch-manager (serial)
2547 start_wqthread
2547 _pthread_wqthread
2547 _dispatch_worker_thread2
2547 _dispatch_queue_invoke
2547 _dispatch_mgr_invoke
2547 kevent
2547 Thread_82390
2547 thread_start
2547 _pthread_start
2547 CAPThread::Entry(CAPThread*)
2547 HALRunLoop::OwnThread(void*)
2547 CFRunLoopRunSpecific
2547 __CFRunLoopRun
2547 mach_msg
2547 mach_msg_trap
2547 Thread_144521
2547 thread_start
2547 _pthread_start
2547 __ape_agent
2547 mach_msg
2547 mach_msg_trap
2097 Thread_223057
2097 start_wqthread
2097 _pthread_wqthread
2097 __workq_kernreturn
Total number in stack (recursive counted multiple, when >=5):
Sort by top of stack, same collapsed (when >= 5):
mach_msg_trap 5094
__spin_lock 2547
kevent 2547
__workq_kernreturn 2097
Sample analysis of process 1448 written to file /dev/stdout
Sampling process 1448 for 3 seconds with 1 millisecond of run time between samples
Sampling completed, processing symbols...
Analysis of sampling prl_vm_app (pid 1448) every 1 millisecond
Call graph:
2547 Thread_82297 DispatchQueue_1: com.apple.main-thread (serial)
2547 start
2547 start
2547 start
2547 CFRunLoopRun
2547 CFRunLoopRunSpecific
2547 0x103c020cd
2547 0x103c02183
2547 __apeapp
2547 __apeapp
2547 APEBundleMainEarlyLoad
2547 WSXCommon_Initialize
2547 WSX_SP_Initialize
2547 AudioServicesCreateSystemSoundID
2547 InitializeSystemSoundPorts(bool)
2547 CFRunLoopAddSource
2547 CFSetApplyFunction
2547 CFBasicHashApply
2547 __CFSetApplyFunction_block_invoke_1
2547 CFRunLoopAddSource
2547 __spin_lock
2547 Thread_82300 DispatchQueue_2: com.apple.libdispatch-manager (serial)
2547 start_wqthread
2547 _pthread_wqthread
2547 _dispatch_worker_thread2
2547 _dispatch_queue_invoke
2547 _dispatch_mgr_invoke
2547 kevent
2547 Thread_82390
2547 thread_start
2547 _pthread_start
2547 CAPThread::Entry(CAPThread*)
2547 HALRunLoop::OwnThread(void*)
2547 CFRunLoopRunSpecific
2547 __CFRunLoopRun
2547 mach_msg
2547 mach_msg_trap
2547 Thread_144521
2547 thread_start
2547 _pthread_start
2547 __ape_agent
2547 mach_msg
2547 mach_msg_trap
2097 Thread_223057
2097 start_wqthread
2097 _pthread_wqthread
2097 __workq_kernreturn
Total number in stack (recursive counted multiple, when >=5):
Sort by top of stack, same collapsed (when >= 5):
mach_msg_trap 5094
__spin_lock 2547
kevent 2547
__workq_kernreturn 2097
Sample analysis of process 1448 written to file /dev/stdout
Attachments
What version of Mac OS X are you running?
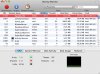
Looks like you're using an Application Enhancer / Haxie. Can you uninstall that or the utility that uses it? Or maybe you can check your System Preferences for an Application Enhancer preference pane where you can add the Parallels virtual machine to the Application Enhancer exclude list or disable the Application Enhancer system entirely (check the troubleshooting section)?
Looks like you're using an Application Enhancer / Haxie. Can you uninstall that or the utility that uses it? Or maybe you can check your System Preferences for an Application Enhancer preference pane where you can add the Parallels virtual machine to the Application Enhancer exclude list or disable the Application Enhancer system entirely (check the troubleshooting section)?
When I Suspend the virtual machine, the prl_vm_app quits after 60 seconds...prl_vm_app only uses about 2% while suspended for that one minute.
Hi Joe-
Interesting reading. I upgraded today from Parallels 3 to Parallels 6. There seems to be a fundamental difference in what a "Suspended" VM means between the two that maybe you can help me understand.
I do indeed see the prl_vm_app in Activity Monitor, and that after Suspending it quits after about 60 seconds.
But I am baffled by the System Memory use of Parallels 6. I have 4 gigs of ram in my iMac running Leopard 10.5.8. With Parallels 6 and my Win XP VM running, I have just over 2 gigs of free ram. But as soon as I Suspend my VM, I can literally watch my Free memory in Activity monitor tick away down to almost nothing in about a minute or so.
I can duplicate this 100%. If I Shutdown my VM, free ram goes to over 2 gigs. But restart Parallels and then Suspend the VM, and the free ram ticks away in about 100mb chunks such that the free memory slice in Activity Monitor counts down at about the pace of a sweep second hand on a watch.
This behavior may be harmless, but it sure seems so different from the behavior of Parallels 3. I know I missed a few versions there, so maybe I'm playing catchup on a huge philosophical change in Parallels. But any expert info would be much appreciated!
Thanks!
Kupe
I'm not sure what you're seeing. I don't use Suspend since I rarely shutdown my Mac. I just put my Mac to sleep. I tried suspending with a Windows XP virtual machine. I did not see the Free memory increase but I'm using 10.6.5 on a Mac Pro with 14 GB of RAM. Also, we may have different Optimization settings, etc.
Can you tell exactly which process is taking the free memory?
Parallels 6 is definitely different than Parallels 3 regarding memory usage but I don't know exactly how.
Can you tell exactly which process is taking the free memory?
Parallels 6 is definitely different than Parallels 3 regarding memory usage but I don't know exactly how.