I've been struggling with this for a long time now, and it's reached a point where my MBP runs so hot and hard all the time that the 85W power adapter can no longer charge my battery and I end up sitting at ~0% charge most of the time with the fans cooking like mad. Finally reached a boiling point today with it and went looking for solutions, tried everything so far and have had no luck in resolving this issue.
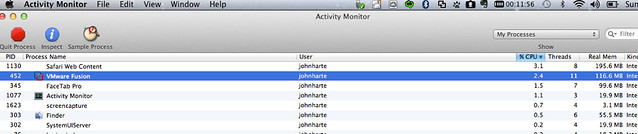
I'm running on a MacbookPro8,3 with 16GB RAM so this thing should be able to practically fly to the moon on it's own resources and back. I've allocated 4GB RAM to the W7 VM, if that somehow matters? prl_vm_app constantly fluctuates and runs between ~75% CPU and ~350% CPU without any interaction on my part, basically just because I have my W7 VM running. I have an external monitor attached, but I don't find any reason or symptom that seems to indicate that could be related.
Admittedly, these specs are pretty beefy for my usage needs, as I'm not using this machine for any gaming, high-intensity software compilation, video-related tasks, etc. It's pretty much just a very nice OSX/Windows hybrid web/iOS development workstation that stays plugged into the AC adapter 99% of the time... that is ideally supposed to afford me the luxury of not having to worry about dealing with limitations in my hardware setup in any situation. Quite literally, this is the ONLY issue that I have encountered with this ~$3500 setup. The only reason I have this model, incidentally, was because I *could* upgrade it to 16GB RAM which allows me to have the VM running on 4GB and not slow down the OSX host by robbing a huge portion of its' available RAM (and slow down my daily workflow in the process).
Windows' Task Manager shows CPU Usage in the 0%-1% (never more) range at the same time that the process in Activity Monitor shows in the above 75%-350% range. Software wise, there's nothing HAPPENING to indicate that this is related to any process firing automatically nor anything that I'm actually doing with the setup. I'm running SQL server, ColdFusion server on IIS7, and IE basically with nothing else of note on the VM side, but this situation happens independent of any action or program that I have running on the VM. Still occurs when I stop the CF/SQL processes and close out IE, which basically gives me a bare W7 instance.
I don't have anything stupid installed like toolbars in IE or whatnot that I've seen indicated as "solutions" to this problem on either the OSX or W7 sides of the equation, so none of those solutions have been helpful. Additionally (and yes, I've got "Show processes from all users" checked) there seems to be a major disconnect between the usage on the CPU in my OSX environment when there's literally NOTHING going on in the W7 environment and it's sitting at 0% usage.
Both OSX and W7 sides have all the software/windows updates up to date, so there really isn't anything more that I can think to do here short of a major runaway process somewhere under the hood of Parallels 7??
Anyone else experiencing this issue? Obviously, I'm a (software and web) developer so I'm not naive to how my system works, but I just can't think of anything else that could cause this sort of bizarre behavior.
Incidentally, my coworker has a nearly identical setup on his nearly identical machine and is having the same issues, so I doubt this is hardware-related or an anomaly with my individual installation.
Typically the best band-aid we've found so far here is to either shut down Parallels and start it back up or sometimes just jumping out of Coherence and back in helps, but overall this is really frustrating and bizarre.
Help?!
Thanks!!