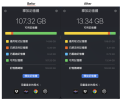
When I use the “Free Memory” tool in Parallels Toolbox for Mac, the reported memory usage increases to around 90% instead of decreasing.
Hardware:
MacBook Pro with M5 Max and 128 GB of unified memory.
Steps to reproduce:
1. Open the “Free Memory” tool in Parallels Toolbox for Mac.
2. Note the memory figures before running the tool.
3. Click “Free Memory” and compare the figures afterward.
Expected result:
The tool frees up memory and increases the amount of available memory.
Actual result:
As shown in the attached before-and-after screenshot (before on the left, after on the right), the tool reports substantially more memory in use after freeing memory:
- Available memory: 107.32 GB before → 13.34 GB after.
- App memory: 14.89 GB before → 108.61 GB after.
- Wired memory: 5.35 GB before → 5.31 GB after.
- Compressed memory: 0.44 GB before → 0.73 GB after.
- Total memory: 128.00 GB.
Available memory drops by 93.98 GB, leaving approximately 90% of the total memory in use according to the tool.
Could you help investigate why running “Free Memory” results in higher reported memory usage, and let me know what diagnostic information you need?
Hardware:
MacBook Pro with M5 Max and 128 GB of unified memory.
Steps to reproduce:
1. Open the “Free Memory” tool in Parallels Toolbox for Mac.
2. Note the memory figures before running the tool.
3. Click “Free Memory” and compare the figures afterward.
Expected result:
The tool frees up memory and increases the amount of available memory.
Actual result:
As shown in the attached before-and-after screenshot (before on the left, after on the right), the tool reports substantially more memory in use after freeing memory:
- Available memory: 107.32 GB before → 13.34 GB after.
- App memory: 14.89 GB before → 108.61 GB after.
- Wired memory: 5.35 GB before → 5.31 GB after.
- Compressed memory: 0.44 GB before → 0.73 GB after.
- Total memory: 128.00 GB.
Available memory drops by 93.98 GB, leaving approximately 90% of the total memory in use according to the tool.
Could you help investigate why running “Free Memory” results in higher reported memory usage, and let me know what diagnostic information you need?